
Mean vs Median: Which Should You Use?
Compare arithmetic mean and median using concrete datasets, outliers and skewed distributions, and learn when reporting both is useful.
QUICK ANSWER
Mean and median summarize a dataset in different ways
The arithmetic mean uses every value and balances the total across the number of observations. The median is the middle value after sorting. Neither is automatically the “correct” average; the more informative statistic depends on the shape of the data and the question you are asking.
IN DETAIL
Arithmetic mean
Mean = sum of values / number of values
For 4, 6 and 8, the mean is (4 + 6 + 8) / 3 = 6. The Average Calculator calculates this arithmetic mean.
IN DETAIL
Median for odd and even counts
Sort the values first. With an odd count, select the middle value. For 2, 5, 9 the median is 5. With an even count, average the two middle values. For 2, 5, 9, 12 the median is (5 + 9) / 2 = 7. The Median Calculator handles both cases.
IN DETAIL
Outliers can pull the mean
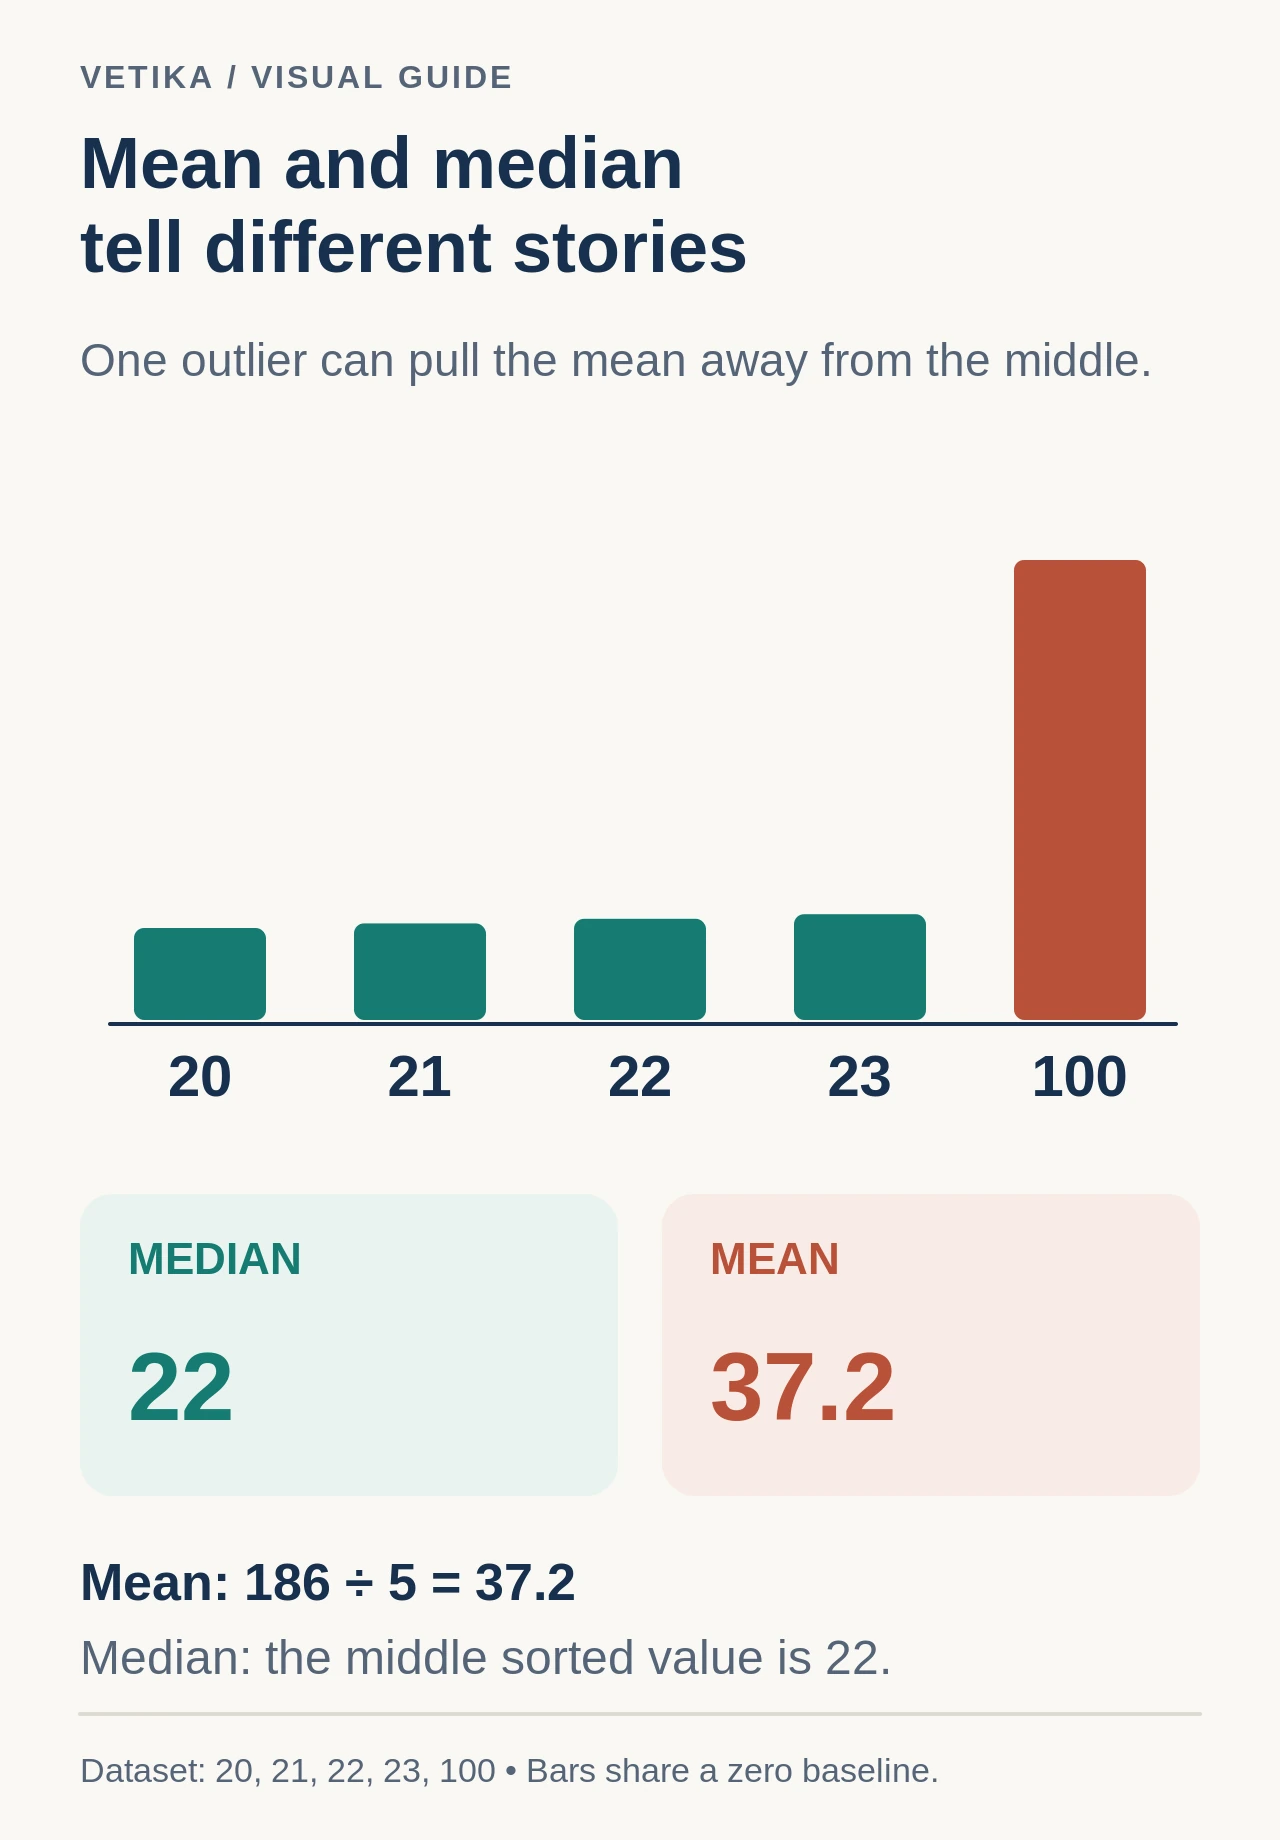
Consider monthly values 20, 21, 22, 23 and 100. The mean is 37.2, while the median is 22. The value 100 changes the total strongly, so the mean moves far from four of the five observations. The median changes much less because it depends on order rather than magnitude beyond the center.
IN DETAIL
Skewed income-style example
Suppose five incomes are 28,000; 31,000; 33,000; 36,000; and 220,000. The mean is 69,600 while the median is 33,000. If the question is “what is the equal-share average of all income?”, the mean is mathematically relevant. If the question is “what does the middle observation look like?”, the median answers that directly. Reporting both often reveals the skew more clearly than choosing one in isolation.
Check your own data with the primary tool.
IN DETAIL
Home-price style data
A neighborhood with mostly similarly priced homes and one extremely expensive property may have a mean sale price noticeably above its median. That does not make the mean wrong. It means the mean reflects the expensive sale in proportion to its magnitude, while the median represents the midpoint of the ordered sales.
IN DETAIL
Small datasets need context
With only three or four observations, both mean and median can change substantially when one value changes. Do not assume the median is automatically stable or “better” simply because a dataset is skewed. Consider sample size, measurement quality and what the summary will be used for.
IN DETAIL
When reporting both helps
- When outliers are real and meaningful rather than data errors.
- When a distribution is visibly skewed.
- When readers may interpret “average” differently.
- When the mean describes total allocation but the median describes a typical middle case.
Open the related tool and apply what you learned.